Observability & Analytics
Guide to monitoring agent performance, reviewing session logs and activity, and analyzing usage and cost
Updated 2026-11-03
Verified 2026-11-03
Cosmos records conversations, tool calls, and model calls so you can see how your agents perform and where to improve them.
Overview
In the sidebar, Operations has four pages:
| Page | What it is for |
|---|---|
| Observability | Dashboard of performance, usage, errors, cost, and evaluation metrics |
| Logs | Individual sessions with transcripts and events |
| Recent Activity | Changes and actions taken in your workspace |
| Expense | Cost reporting |
ℹ️ You need the view-metrics permission for the dashboard and the view-logs permission for Logs. If a page is missing, ask your organization admin.
Dashboard
Open Observability to see the Tech Observability dashboard.
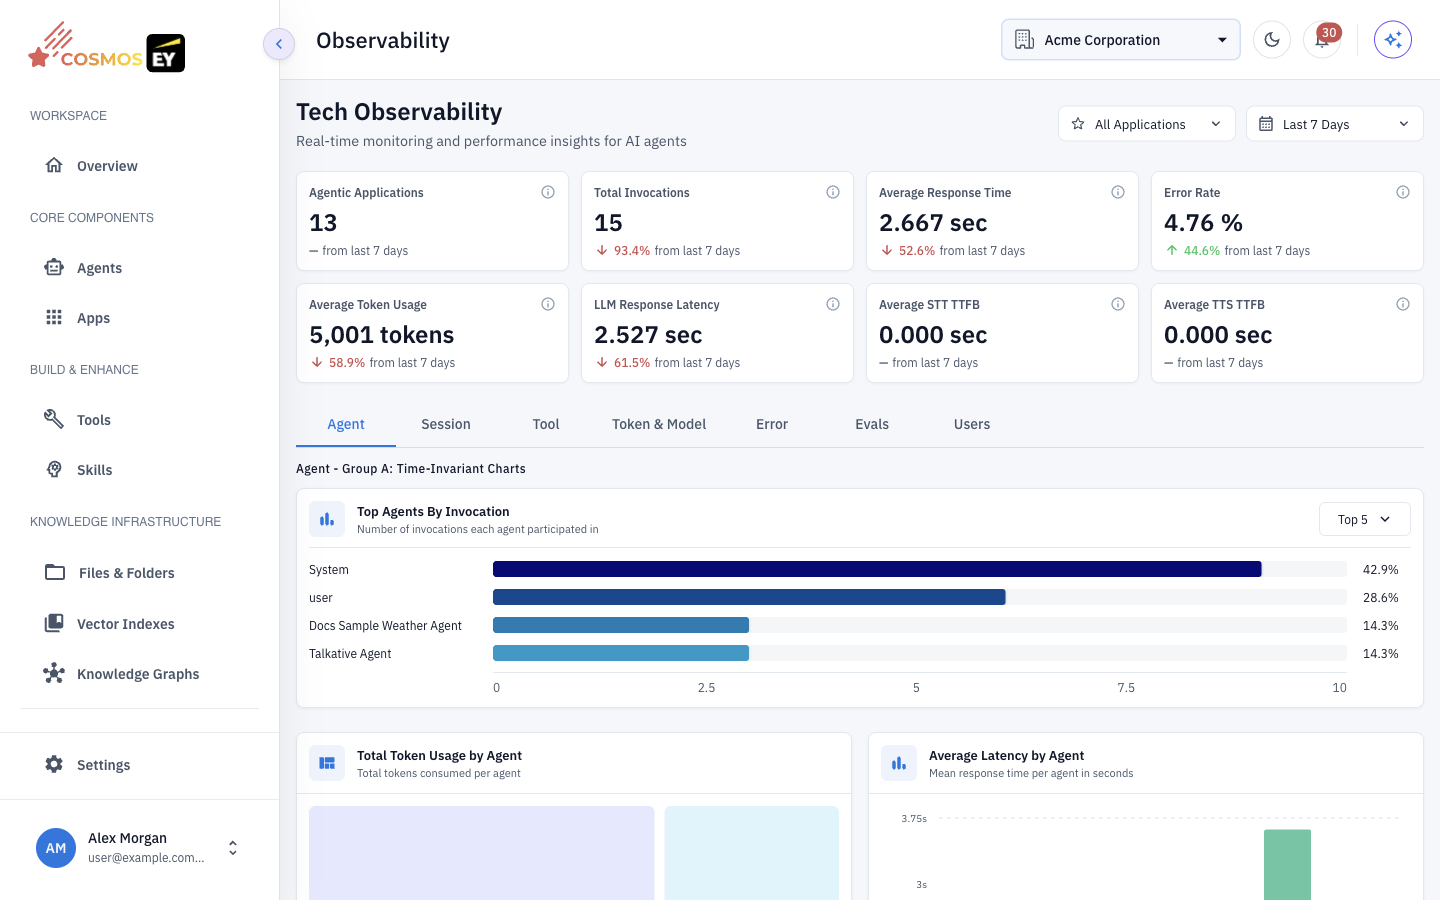
Filters
| Filter | What it does |
|---|---|
| App | Show all apps (All Applications) or one app. |
| Date Range | Last 1 day, Last 2 days, Last 3 days, Last 7 days, Last 30 days, Last 90 days, or a Custom Range. |
| Time Dimension | Group data Hourly, Daily, Weekly, or Monthly. |
KPI cards
The cards at the top summarize the selected period: Agentic Applications, Total Invocations, Average Response Time, P50/P95/P99 latency, Error Rate, Average Token Usage, LLM Response Latency, and, for voice, Average STT TTFB and Average TTS TTFB (time to first byte for speech recognition and speech synthesis).
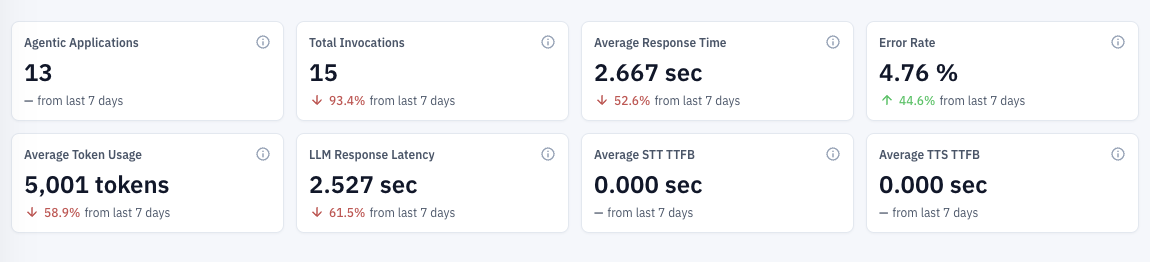
Dashboard tabs
| Tab | Typical charts |
|---|---|
| Agent | Agent invocations, invocation volume analysis, agent throughput, latency by agent, average response time |
| Session | Session count, completed sessions, session latency, sessions by channel |
| Tool | Tool usage frequency, success rate, tool call latency, top 5 high-latency tools, top 5 tool errors, average tool calls per session |
| Token & Model | Token usage and distribution (input, output, cached), LLM latency by model, STT processing time by model, token cost by agent |
| Error | Agent error rate, errors by agent, errors by type |
| Evals | Eval runs over time, score trend, eval calls by judge model, judge latency |
| Users | Active, new, and returning users, and user activity overview |
💡 Start with the KPI cards and the Error tab for a quick health check, then drill into the agents or tools that need attention.
Logs
Open Logs to browse individual sessions on the Activity Logs page.
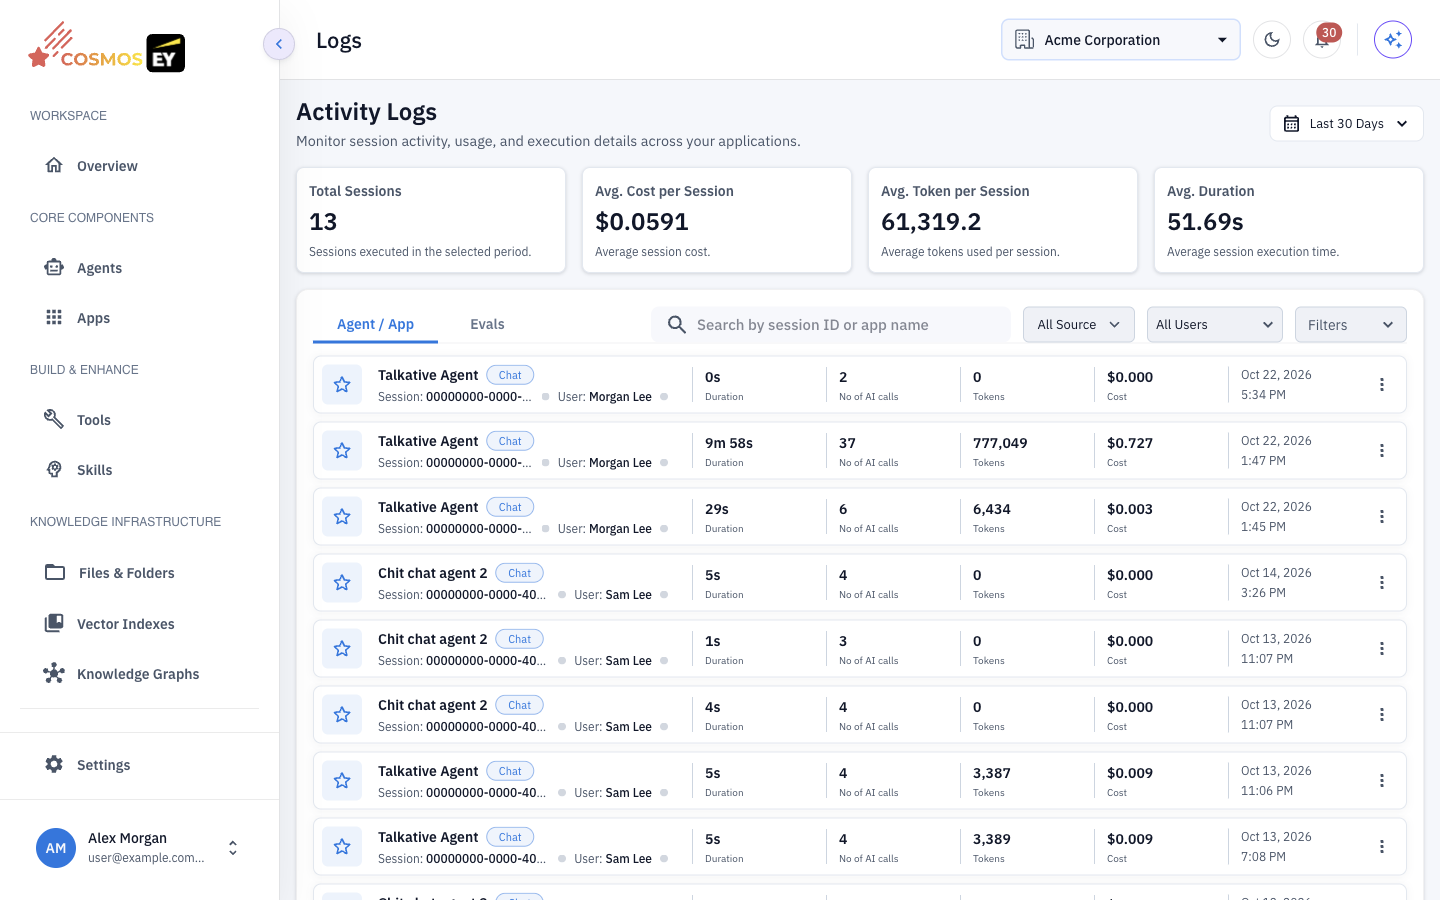
Finding sessions
- View — switch between Agent / App sessions and Evals sessions.
- Date range — from Today up to Last 3 Months, or a custom range.
- Source — All Source, Chat, Voice, Email, or WhatsApp.
- Filters — narrow by fields such as session, user, or app. Active filters appear as chips you can remove one by one.
Summary statistics above the table cover the filtered sessions.
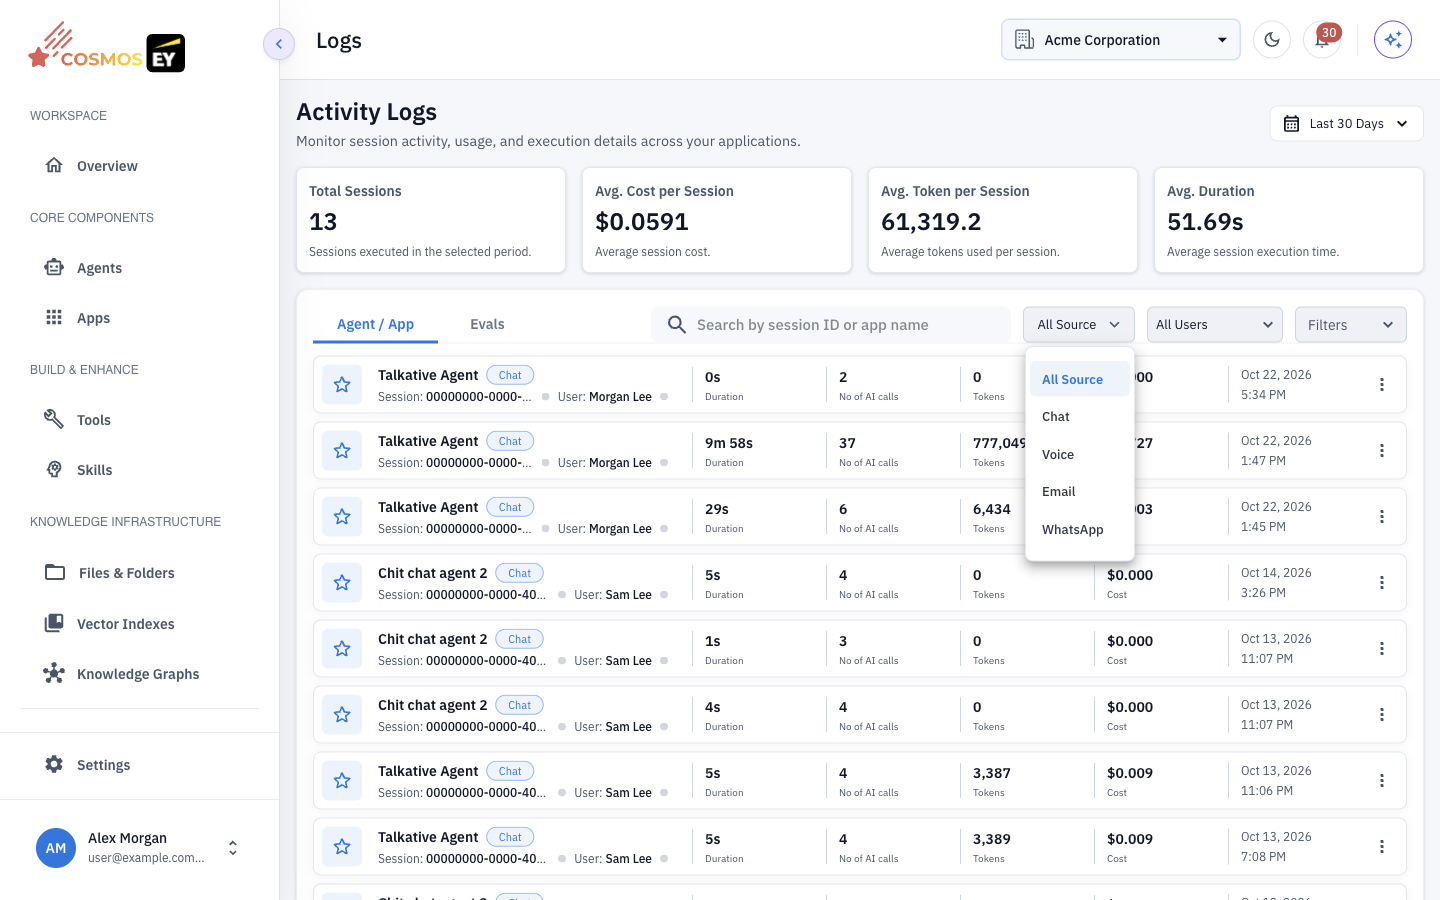
The table shows Session, User, APP, Duration, No of AI calls, Tokens, and Cost.
Inspecting a session
From a session's actions choose:
| Action | What it shows |
|---|---|
| View Details | Session summary and metadata |
| View Transcript | The conversation between the user and the agent |
| View Events | The Events Timeline: model calls, tool calls with arguments and responses, state changes, and errors |
| View QA | Quality review scores for the session. It appears only for sessions that come from a connected media gateway. |
For model calls you can open Raw LLM Data to see the request and response sent to the model. Markers such as PII Detected and Guardrail Triggered show where guardrails acted.
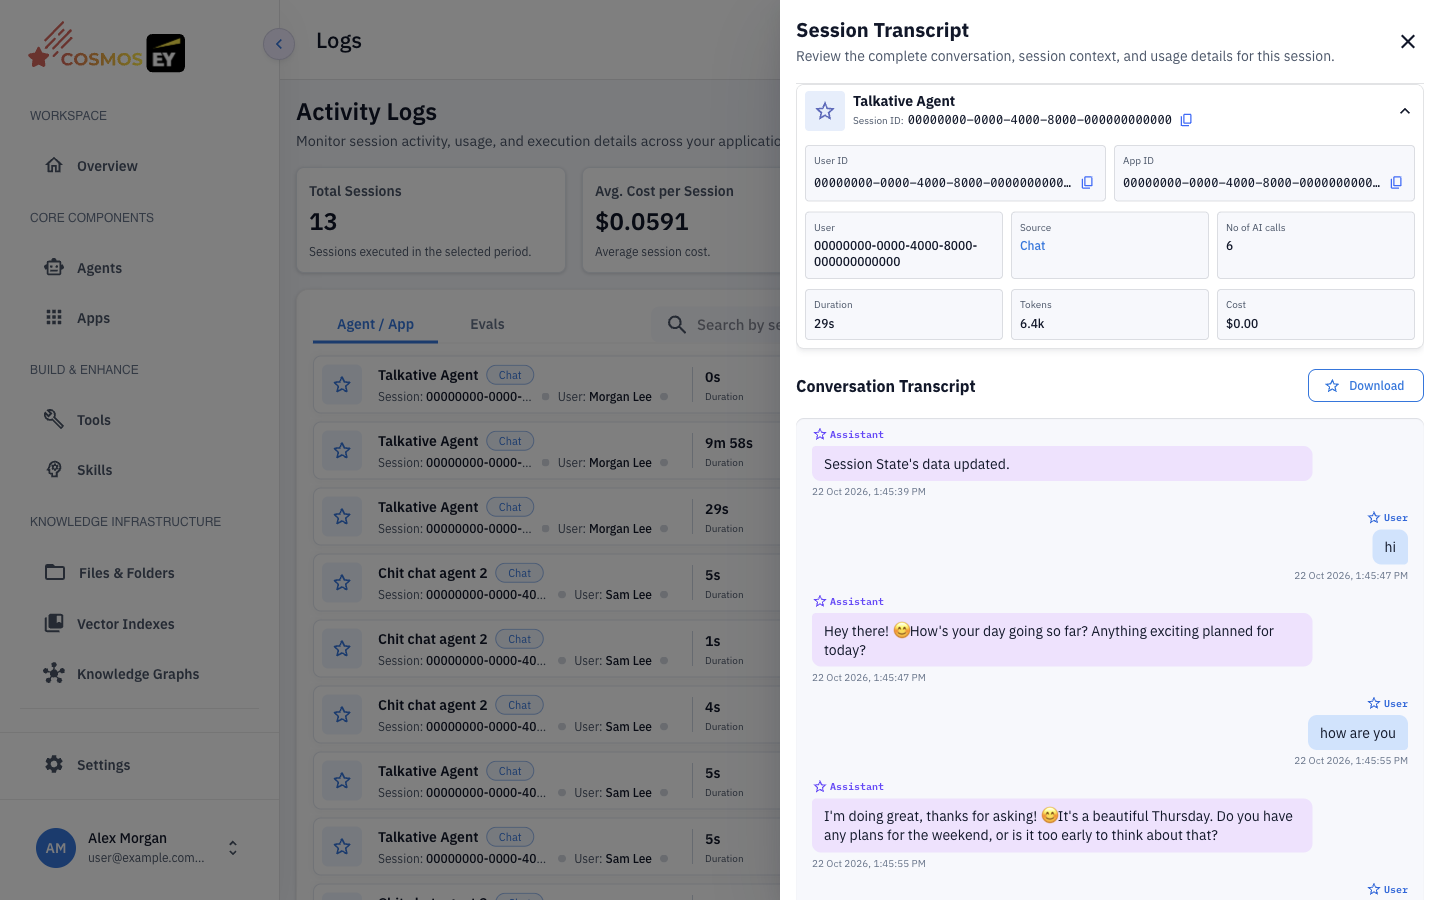
ℹ️ If PII masking is on, personal data in transcripts is masked. Users with permission can reveal the original text.
Recent Activity
Recent Activity lists recent actions in your workspace, such as creating, editing, or deploying resources. Use the filters to narrow the list. The activity bell in the header shows the same kind of updates as notifications.
Exporting Data
You can read observability data through the Observer API, for example to feed your own BI tools:
- Sessions —
GET /api/v1/sessions - Events —
GET /api/v1/events?session_id=<id> - Invocations —
GET /api/v1/invocations?session_id=<id> - Metrics —
POST /api/v1/metricsruns a metrics query
# Example: list sessions for one app
curl -s "$OBSERVER_URL/api/v1/sessions?app_id=$APP_ID&page_size=100" \
  -H "Authorization: Bearer $TOKEN" \
  -H "X-Org-Id: $ORG_ID" | jq '.results'
Replace $OBSERVER_URL with the Observer address for your environment. Results are paginated; use the page parameter to read all records. See the Observer Queries API reference.
Alerts
Automated alerting is not available in the Cosmos UI. To watch agent health proactively, poll the metrics API on a schedule and raise alerts in your own monitoring tools when error rates or latency cross a threshold.
Tips & Best Practices
- Check errors after every deployment. A jump in agent or tool errors often means a misconfigured tool or a prompt regression.
- Watch P95, not just the average. A good average can hide a slow tail.
- Compare channels. Voice adds speech recognition and synthesis time that chat does not have.
- Track cost by agent in Token & Model and in Expense, and switch to lighter models where it makes sense.
- Inspect failed tool calls in View Events. The arguments and error message usually show the cause.